Home » Featured Articles » Visual Search in Time-Oriented Research Data for Digital Libraries
Visual Search in Time-Oriented Research Data for Digital Libraries
Today’s digital libraries and data centers store huge amounts of data, collected, for example, by scientific experimentation, earth observation, or simulation. The common approach to support user navigation and retrieval in these libraries operates on meta-information that is manually appended to the datasets. Especially for large datasets, this approach quickly reaches its limits due to scalability with respect to manual annotation.
An important task specific to digital libraries of time-oriented data is to find similarities or correlations between different time series, for example, specific patterns or periodic curve progressions, as scientific users need more than a textual query specification. The aim is content-based search, i.e. search on the data itself.
This task is addressed by a cooperative research project of the German National Library of Science and Technology in Hannover (TIB) together with the Technical University of Darmstadt and the Fraunhofer Institute for Computer Graphics Research (IGD). The project is funded by the Leibniz Association as part of the “Joint Initiative for Research and Innovation”.
The baseline approach that will be developed allows descriptor-based similarity search with respect to data features of the time series graphs in the library. We plan the following steps to realize this approach. Firstly, during a preprocessing step the raw datasets are transformed to a standardized format. Normalization techniques including data discretization, transformation, interpolation, and outlier and missing value treatment will be developed.
Secondly, the different time series will be made comparable. Therefore, a flexible, user-adaptive similarity measure defined on descriptors will be defined. First descriptors based on the Fourier and the Wavelet transformations are supported as well as a simple binning-based descriptor that consists of a discretized representation of the scientific measurements. In addition, descriptors based on symbolic representations of the data will be provided. By help of such descriptors, the time series are made comparable and searchable.

Figure 1: Left: Visual times series catalogue, provided by cluster analysis. Right: Detailed view with blue overlays of 1, 3, 10 and 20 comprised time series.
To provide an overview of large sets of time series data in a digital library, a visual catalogue is designed. It is computed based on a visual clustering algorithm, offering representatives of the actual data ordered by their similarity (see Figure 1). The visual vicinity of a pattern corresponds to the similarity of the represented time series.
Based on this visual catalogue, our approach allows the user to visually specify a query by means of different query modalities including “query by sketch” and “query by example”. For example, it will be possible to specify a query by selecting from the visual catalogue or by sketching a curve (see Figure 2).

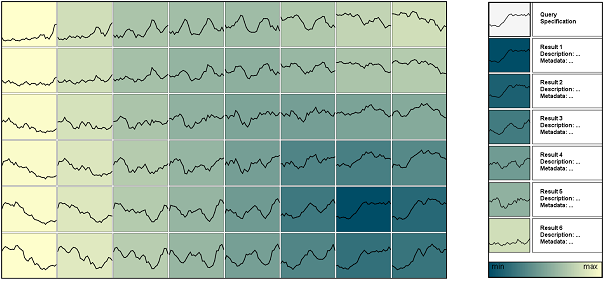
Figure 3: Left: Color-coded visual clustering result, based on a grid layout. Right: Result as a list with additional metadata.
A first approach to present the result of such queries consists of using color-coding on the visual catalogue that depicts the similarity between the time series via a color gradient. Furthermore, a separate list view with the time series most similar to the specified query curve is visualized (see Figure 3).
At the current stage of the project, a first prototype implementation is applied to a large sample of data publicly available through the online information system “Pangaea” hosted by the Alfred Wegener Institute for Polar and Marine Research (AWI) in Germany.
The project will take an overall duration of three years. In the first stage of the project, the core functionality will be developed together with library experts and taking into account evaluations by expert users from the scientific data user community.
In the second stage, a prototype system will be implemented and extended. The expected outcome is the ability to provide content-based visual search functionality for application on time series research data in a digital library context. This project looks for new content-based search and visualization functionality in the area of visual analysis of scientific time series data. Furthermore, we expect insights into how to effectively combine content-based and textual metadata queries, based on multiple descriptors and heterogeneous textual metadata bases.
Contact Details:
Tobias Ruppert – tobias ruppert
 igd
igd fraunhofer
 de
de
Jörn Kohlhammer – joern kohlhammer
 igd
igd fraunhofer
 de
de
Fraunhofer IGD, Darmstadt, Germany
Jürgen Bernhard – juergen bernhard
 gris
gris informatik
 tu-darmstadt
 de
de
Tobias Schreck – tobias schreck
 gris
gris informatik
 tu-darmstadt
 de
de
TU Darmstadt, Germany


0 Comments
You can be the first one to leave a comment.