Home » Conferences » Science beyond Fiction – The European Future Technology Conference FET09
Science beyond Fiction – The European Future Technology Conference FET09
 Penetrating Vision – Visualising large sets for data.
On a typical day, the international courier Fedex handles some 100 million individual transactions. Worldwide, VISA records 150 million purchases. Every 24 hours, more than 300 million long distance calls stream over ATT’s telephone network. Every one of these shipments, purchases or calls generates a file of data, and this staggering amount of data increasingly drives our information-dominated age.It is routinely archived away as a valuable storehouse of insights and value. Yet the sheer volume of data, and the increasing rate at which this is produced, also pose a problem — how to avoid drowning in it, and how to find useful ways to get meaningful insight out of it.
A popular blogger, for example, scans more than 5,000 news feeds each day, and still can’t keep pace with all that is going on. Biologists are now sequencing genes so quickly that just finding ways to store this data in an organized way has become a major challenge. Yet just as Google gave us a tool to make useful the overwhelming information store of the World Wide Web, computer scientists are pioneering a raft of new techniques to help us penetrate the growing forest of digital data. Among the most exciting is an ambitious effort to combine humans’ innate skills for recognizing patterns and reasoning creatively with the raw processing power of modern computing to make both more capable than they could be alone.
“Computers do much better at some things than people,” says computer scientist Daniel Keim of the University of Konstanz, “but not at perception. The human visual system is still better, and humans are also better at creativity and general knowledge. Nothing in computation can compete with a 10 yr old child when it comes to wide ranging knowledge.”
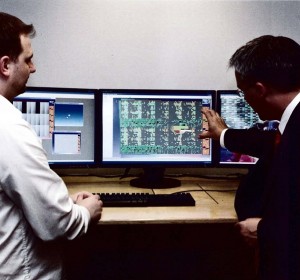
In pursuing a beneficial union, researchers in this area of “visual analytics” aim to exploit the insights of disciplines ranging from computer science to human psychology. The basic idea is to take enormous volumes of information, often from diverse sources, and find ways to present this naturally unwieldy information visually so that people can make use of it easily and quickly, seeing connections they’d never see on their own. An air traffic controller, for example, might see a collage of coloured lines reflecting the trajectories and locations of various aircraft, as well as airport traffic conditions, and be able to see immediately a red triangle indicating a
potential problem, long before they could work this out from the data alone.
Within a decade, these insight-enhancing tools will be indispensable for public health officials, leaders of major businesses and many others in positions of authoriy. But visual analytics won’t remain a specialized tool for long.
“Pretty soon, it won’t only be high authorities using these tools,” says Keim. “We envision them being common in the workplace for every employee to use who has to deal with the analysis of the ever change information.”
Which is likely to be just about everyone, ranging from financial analysts charged with finding cues to sound investments in rivers of financial and economic data to doctors aiming to make better diagnoses by combining the vast knowledge of medical science with data on an individual patient’s history, lifestyle and physiology. Making it possible, Keim points out, will mean resolving a host of pressing issues.
A first problem is that data currently tends to get collected and stored in whatever forms is most convenient for whoever is collecting it, without thought for how it might one day be linked up to other, very different data, and to beneficial effect. Computer scientists have to find ways to store photos, time series, scientific data, ordinary text and data of many other kinds so that it can be combined in a meaningful way, and lead to insight.
Progress on this seemingly mundane issue would free up people from the unproductive task of converting data formats and let them focus their experience and skills on more important work.
A second problem is learning how to pare down massive data sets into more manageable parts. Almost any data set has errors in it, or suffers from corrupting influences, and computer scientists need to find ways to automatically identify these uncertain parts so they can be eliminated, or at least be recognized. Even without errors, moreover, most of an enormous data set may be completely irrelevant to certain kind of questions; hence, visual analytics aims to find techniques for filtering data to make it more manageable to analyses focused on specific questions.
Finally, another key challenge is to find efficient ways to turen extremely large and complex data sets automatically into visual displays that present information usefully to the human brain. This demands not only good technology, but attention to human biology as well. We naturally process some kinds of visual cues automatically and without conscious attention. Things like line orientation, lenngth, width, size and curvature tend to “pop out” at us, and data presented this way enters the mind easily. That’s good if such information is important, and very bad if it is distracting.
These are only some of the demanding issues research in visual analytics need to tackle none of which has yet been solved completely. But visual analytics promises to bring huge advantages to any human facing information overload, a problem likely to become ever more common in tomorrow’s world. Visual display, the science suggests, can expand a person’s working memory, let them search through lots of information very quickly, bring patterns out more obviously, and see relationships that would otherwise be obscure. All of which we’ll need in tomorrow’s even more complex and faster changing world.

0 Comments
You can be the first one to leave a comment.