Visual Analytics: How Much Visualization and How Much Analytics?
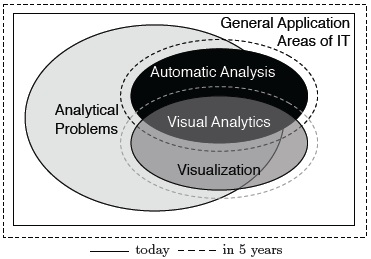
The term Visual Analytics has been around for almost five years by now, but still there are on-going discussions about what it actually is and in particular what is new about it. The core of our view on Visual Analytics is the new enabling and accessible analytic reasoning interactions supported by the combination of automated and visual analysis. In this paper, we outline the scope of Visual Analytics using two problem and three methodological classes in order to work out the need for and purpose of Visual Analytics. Thereby, the respective advantages and disadvantages of automated and visual analysis methods are explained plus examples of analytic reasoning interaction leading to a glimpse into the future of how Visual Analytics methods will enable us to go beyond what is possible when separately using the two methods.
Read the full article here:
Visual Analytics: How Much Visualization and How Much Analytics?
D. A. Keim, F. Mansmann, J. Thomas: Visual Analytics: How Much Visualization and How Much Analytics?, SigKDD Explorations Journal, December, 2009.
0 Comments
You can be the first one to leave a comment.