Collaborative Geovisual Analytics applied to regional statistical temporal data
http://ncva.itn.liu.se/explorer

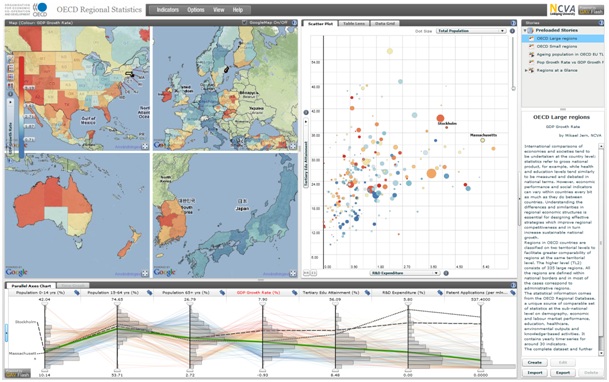
Recent advances in web-enabled graphics technologies have the potential to make a dramatic impact on developing highly interactive Geovisual Analytics applications for the Internet. An emerging and challenging application domain is geovisualization of regional (sub-national) statistics. Higher integration driven by institutional processes and economic globalisation is eroding national borders and creating competition along regional lines in the world market. Sound information at sub-national level and benchmarking of regions across borders, therefore, has increased in importance in the policy agenda of many countries. In this presentation, NCVA introduces “OECD eXplorer” – an interactive tool for analyzing and communicating gained insights and discoveries about spatial-temporal and multivariate OECD regional data.
Storytelling
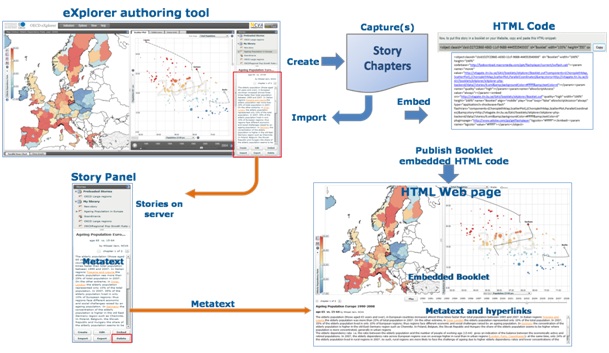
NCVA develops novel “storytelling” means to explore large, temporal and multidimensional statistical data, collaborate and communicate gained insight and knowledge using interactive visualization “booklets” embedded in standard HTML or Wiki documents. The ambition is to let the analyst (author) first explore data and simultaneously save important discoveries and thus enable sharing of gained insights. The story mechanism includes essential descriptive metatext, textual annotations hyperlinked through the eXplorer snapshot mechanism that integrates with visualization. The author can let the reader follow the analyst’s way of logical reasoning. Readers will benefit from receiving an interactive document that can “coach” them in the understanding and testing of hypotheses leading to faster understanding and a higher confidence level in the presented visual information.

From creating a story in eXplorer “EU OECD eXplorer” to a published booklet embedded in a Web page with associate metatext and hyperlinks. This two-steps but integrated approach into “story authoring” and “story telling” follows a recommendation from the Visual Analytics research field. A story with metatext is created in eXplorer; HTML code is generated and finally embedded into any Web page. See result embedded in a Booklet at: http://vitagate.itn.liu.se/GAV/booklets/html/test1.html
Jern M,” Collaborative Web-Enabled GeoAnalytics Applied to OECD Regional Data”, Reviewed article in “Cooperative Design, Visualization, and Engineering”, pages 32-43, September 2009, Springer Berlin/Heidelberg.
http://www.springerlink.com/content/282572683x16603v/

0 Comments
You can be the first one to leave a comment.