Home » News (Page 3)
-
VAST 2010 Best Paper: "Visual Readability Analysis"
Jan 12, 2011 9:20
The Konstanz group presented a tool that is specifically designed to support a writer in revising a draft-version of a document....
-
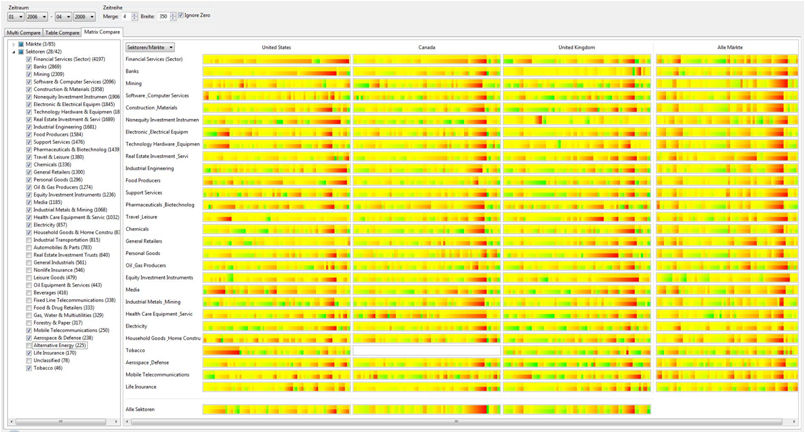
Visual Market Sector Analysis for Financial Time Series Data
Jan 11, 2011 15:20
The massive amount of financial data that originates from the stock markets generates large amounts of complex financial...
-
Call for Participation – CHI 2011 Workshop on Analytic Provenance CFP
Call for Participation Workshop on Analytic Provenance: Process + Interaction + Insight* *CHI 2011* May 7-8, 2011 in Vancouver,...
-
iVAC Newsletter November 2010

Dec 13, 2010 12:10
Attached is the November 2010 edition of the Integrated Visualization and Analytics Community (iVAC) Newsletter. The...
-
iVAC Newsletter October 2010
Nov 15, 2010 17:09
Attached is the October 2010 edition of the Integrated Visualization and Analytics Community (iVAC) Newsletter. The...
-
VISMASTER drives visual analytics and technology in Europe
Oct 2, 2010 13:47
The EU CORDIS site just released a news headline on VisMaster in different languages: English: Technological advances are...
-
iVAC Newsletter September 2010
Sep 30, 2010 21:43
Attached is the September 2010 edition of the Integrated Visualization and Analytics Community (iVAC) Newsletter. The...
-
Tools about the new London Bike Hire scheme

Sep 8, 2010 10:05
BikeGrid reveals geographic patterns in London bike hire usage A new interactive application written by the giCentre uses...
-
Making Hurricane Track Data Accessible

Sep 8, 2010 9:20
We worked with climate scientists at NCAS-Climate (University of Reading, UK) who produce large datasets of simulated storm...
-
iVAC Newsletter June 2010

Aug 19, 2010 10:50
Attached is the June 2010 edition of the Integrated Visualization and Analytics Community (iVAC) Newsletter. The Basic/Futures...
Latest Comments